Home »
Python »
Python Data Visualization
Python | Markers Edge Styles in Matplotlib
In this article, we are going to explore different markers edge styles available in Python matplotlib.
Submitted by Anuj Singh, on August 22, 2020
Illustrations:


Python code for markers edge styles in matplotlib
import numpy as np
import matplotlib.pyplot as plt
x = np.arange(25)
y = np.random.randint(1,15,25)
plt.figure()
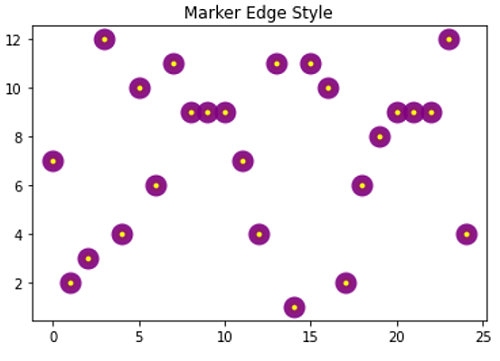
plt.plot(x, y, 'o', markersize=10, markerfacecolor='yellow',
markeredgecolor='purple', markeredgewidth=2.0, alpha=0.9)
plt.title('Marker Edge Style')
#############################################
#############################################
x = np.arange(25)
y = np.random.randint(1,15,25)
plt.figure()
plt.plot(x, y, 'o', markersize=10, markerfacecolor='yellow',
markeredgecolor='purple', markeredgewidth=6.0, alpha=0.9)
plt.title('Marker Edge Style')
#############################################
#############################################
x = np.arange(25)
y = np.random.randint(1,15,25)
plt.figure()
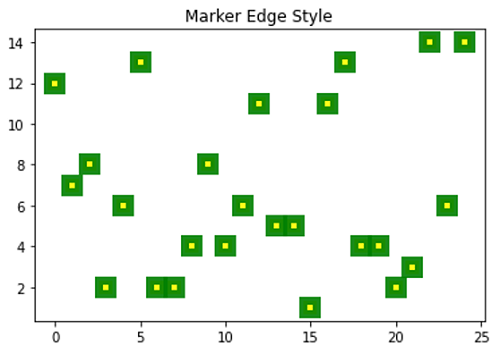
plt.plot(x, y, 's', markersize=10, markerfacecolor='yellow',
markeredgecolor='red', markeredgewidth=2.0, alpha=0.9)
plt.title('Marker Edge Style')
#############################################
#############################################
x = np.arange(25)
y = np.random.randint(1,15,25)
plt.figure()
plt.plot(x, y, 's', markersize=10, markerfacecolor='yellow',
markeredgecolor='green', markeredgewidth=6.0, alpha=0.9)
plt.title('Marker Edge Style')
#############################################
#############################################
x = np.arange(25)
y = np.random.randint(1,15,25)
plt.figure()
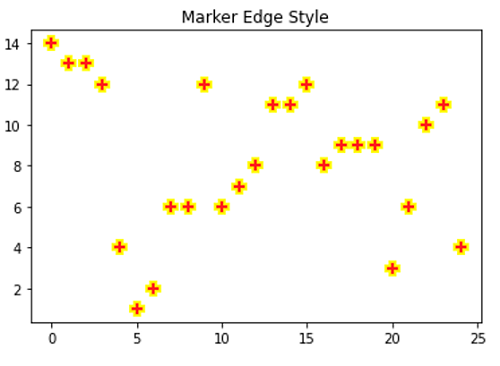
plt.plot(x, y, 'P', markersize=10, markerfacecolor='red',
markeredgecolor='yellow', markeredgewidth=2.0, alpha=0.9)
plt.title('Marker Edge Style')
#############################################
#############################################
x = np.arange(25)
y = np.random.randint(1,15,25)
plt.figure()
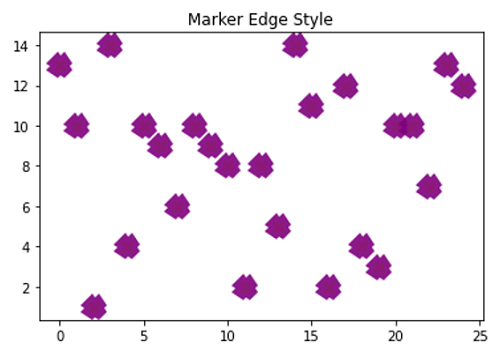
plt.plot(x, y, 'X', markersize=10, markerfacecolor='yellow',
markeredgecolor='purple', markeredgewidth=7.0, alpha=0.9)
plt.title('Marker Edge Style')
Output:
Output is as Figure
Advertisement
Advertisement