Home »
Python »
Python Data Visualization
Python | Marking Regions across Horizontal Axis in Plot
In this tutorial, we are going to mark regions across the horizontal axis in a plot for better distinguishing it from the rest of the plot.
Submitted by Anuj Singh, on August 01, 2020
It is a small plotting/data visualization technique used often and has a good application in areas of Physics Plotting. The following example shows an example of region marking by using inbuilt functions in Matplotlib.
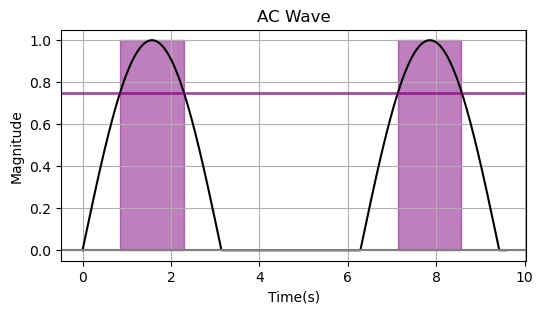
Python code for marking regions across horizontal axis in plot
import numpy as np
import matplotlib.pyplot as plt
x = np.arange(0, 4 * np.pi - 3, 0.01)
y = np.sin(x)
for i in range(len(y)):
if y[i] <= 0:
y[i] = 0
plt.figure(figsize=(6,3))
plt.plot(x, y, color='black')
threshold = 0.75
plt.axhline(threshold, color='purple', lw=2, alpha=0.7)
plt.fill_between(x, 0, 1, where=y > threshold, color='purple', alpha=0.5)
plt.xlabel('Time(s)')
plt.ylabel('Magnitude')
plt.axhline(y=0, color='grey')
plt.grid()
plt.title('AC Wave')
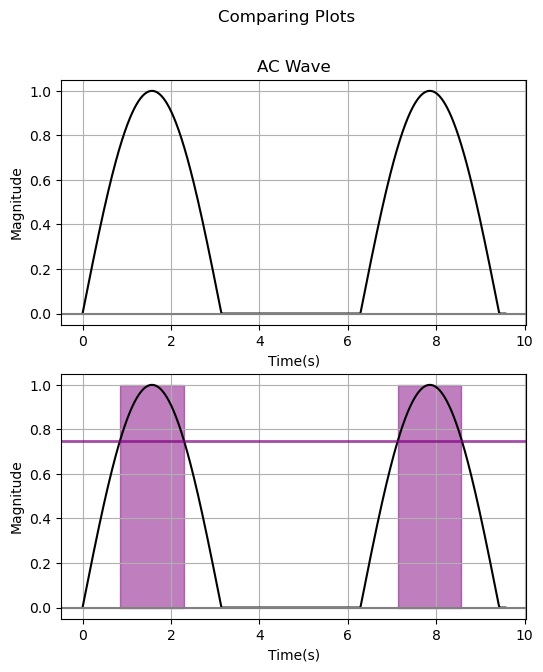
plt.figure(figsize=(6,7))
plt.subplot(211)
plt.plot(x, y, color='black')
plt.xlabel('Time(s)')
plt.ylabel('Magnitude')
plt.axhline(y=0, color='grey')
plt.grid()
plt.title('AC Wave')
plt.subplot(212)
plt.plot(x, y, color='black')
threshold = 0.75
plt.axhline(threshold, color='purple', lw=2, alpha=0.7)
plt.fill_between(x, 0, 1, where=y > threshold, color='purple', alpha=0.5)
plt.xlabel('Time(s)')
plt.ylabel('Magnitude')
plt.axhline(y=0, color='grey')
plt.grid()
plt.suptitle('Comparing Plots')
Output:
Output is as figure
Advertisement
Advertisement