Home »
Python »
Python Data Visualization
Python | Winter Colormap for Plotting Figure
In this article, we are going to learn how to apply winter colormap in a python figure using matplotlib?
Submitted by Anuj Singh, on August 18, 2020
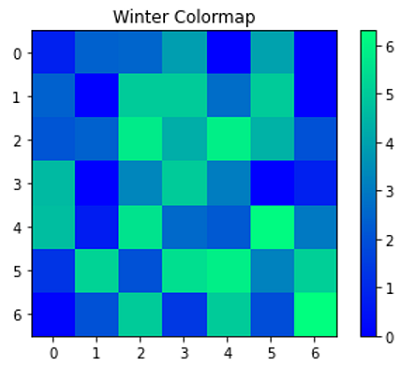
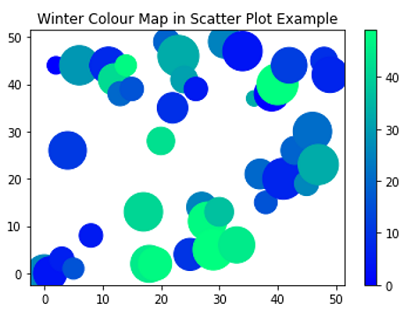
Winter colormap is used in contrast plotting and in the following example, we have illustrated the use of winter colormap in scatter and a simple heatmap plot. Matplotlib.pyplot has an inbuilt defined function for winter plotting i.e. matplotlib.pyplot.winter().
Illustrations:
Python code for winter colormap for plotting figure
import numpy as np
import matplotlib.pyplot as plt
imm = np.array([[0.8, 2.4, 2.5, 3.9, 0.0, 4.0, 0.0],
[2.4, 0.0, 5.0, 5.0, 2.7, 5.0, 0.0],
[2.1, 2.4, 5.8, 4.3, 5.9, 4.4, 2.0],
[4.6, 0.0, 3.3, 5.0, 3.1, 0.0, 0.8],
[4.7, 0.7, 5.6, 2.6, 2.2, 6.2, 3.0],
[1.3, 5.2, 2.0, 5.5, 5.9, 3.2, 5.1],
[0.1, 2.0, 5.0, 1.4, 5.0, 1.9, 6.3]])
plt.figure()
plt.imshow(imm)
plt.winter()
plt.colorbar()
plt.title('Winter Colormap')
plt.show()
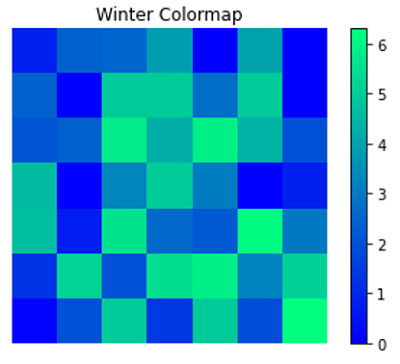
plt.figure()
plt.imshow(imm)
plt.winter()
plt.colorbar()
plt.axis(False)
plt.title('Winter Colormap')
plt.show()
##################################
x = np.arange(50)
y = np.random.randint(0,50,50)
ss = np.random.randint(0,50,50)
c = np.random.randint(0,50,50)
plt.figure()
plt.winter()
plt.scatter(x,y, s=ss*25, c=c, marker='o')
plt.title('Winter Colour Map in Scatter Plot Example')
plt.colorbar()
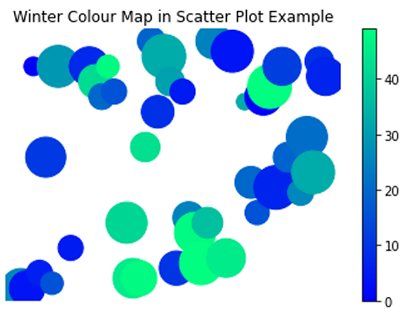
plt.figure()
plt.winter()
plt.scatter(x,y, s=ss*25, c=c, marker='o')
plt.title('Winter Colour Map in Scatter Plot Example')
plt.axis(False)
plt.colorbar()
Output:
Output is as Figure
Advertisement
Advertisement