Home »
Software Engineering
State Chart Diagram in Unified Modeling Language (UML)
In this tutorial, we will learn about the state chart diagram in unified modeling language (UML), its types, and examples.
By Monika Sharma Last updated : April 05, 2023
What is State Chart Diagram in UML?
A state machine of the states of objects defined by State Chart Diagram. The state machine can be called a machine that tells different states of an object and these states are controlled by internal or external events. A state chart diagram is a kind of diagram used in CS and a similar field to tell us about the nature of the system. The Special kind of a diagram is the Statechart diagram is known as Activity Diagram. It is used to the model of the states of objects of the time of life of an object so it is known as the Statechart diagram. It shows the various states as for transition for everything in the diagram.
Basics of State Chart Diagram
- It is one of the important UML diagrams used to model the spirited nature of a system.
- The important aim of a diagram is to creation to termination from the states of objects.
- These are also used for ahead and opposite engineering of a system. The main aim is to model the responsible system.
- They describe different types of states of an object during its time of life and these states are updated by events and places where it used.
-
The main purposes of using Statechart diagrams are follows,
- Design the dynamic aspect of a system.
- During its lifelong time defines the states of an object.
- Model the time of a responsible system in states.
- Tell a state product to design the states of an object.
Types of State Chart Diagram
There are two types of state chart diagram: behavioral state chart diagram and protocol state chart diagram.
1) Behavioral state chart diagram
- It stores the behavior of an entity present in the system.
- It is used to shows the represent the particular types of implementation of a state of object.
- The behavior of a system of objects can be shaped the diagram using this diagram.
2) Protocol state chart diagram
- These state chart diagrams are used to capture or click the behavior or nature of a system of the objects used in the diagram.
- It shows how the state of objects of protocol updates concerning the event in the place. It also represents corresponding changes in the system of the states of objects in the diagram.
- They don't represent the particular or simple implementation of an element of the states of the objects of the diagram.
Where to Operate State Chart Diagram?
- To represent the states of a system.
- Ahead and just opposite engineering.
- To represent the reactive system and responsible system consists of reactive states.
- To recognize the events responsible for updates of the system.
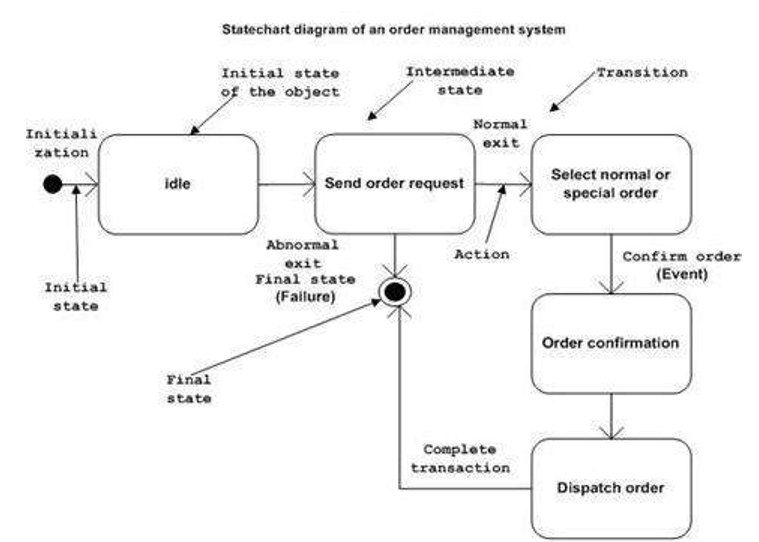
Drawing of State Chart Diagram
These are very useful for defines the states. States can be guessed as the condition of objects when an event takes place.
Before drawing a diagram we should know the following parts,
- Recognize the important objects to be analyzed
- Recognize the states
- Recognize the events
State Chart Diagram Example
Simple ATM Diagram
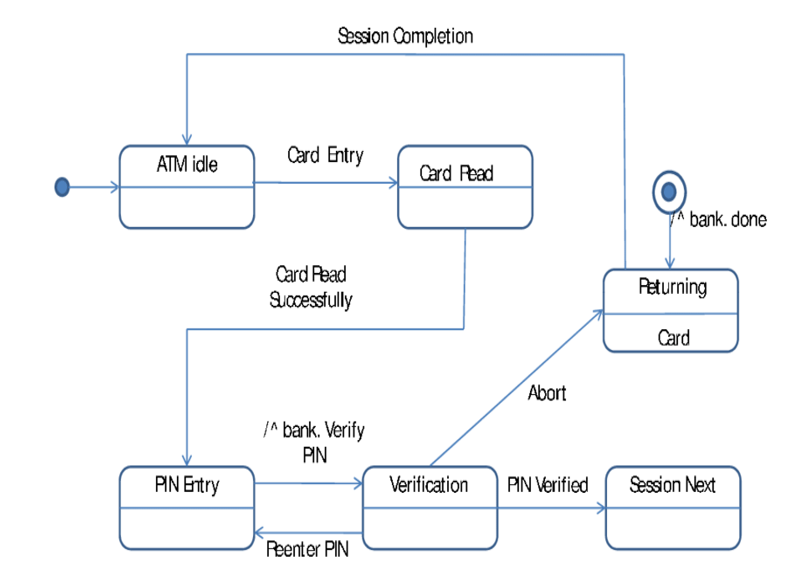
Image source: https://www.researchgate.net/figure/Statechart-Diagram-of-ATM_fig3_220299153
Advertisement
Advertisement