Home »
MCQs »
Data Analytics and Visualization MCQs
Following chart is an example of,
2. Following chart is an example of,
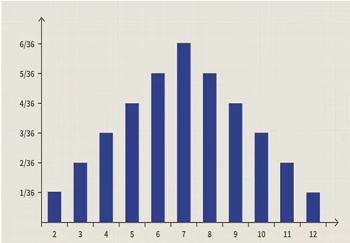
- Probability Distribution Chart
- Line chart
- Pie chart
- All of the mentioned above
Answer: A) Probability Distribution Chart
Explanation:
A probability distribution is, in essence, a bar chart that depicts the likelihood of an event occurring in the future. It's a quick way to see what's going on and how likely it is that something will happen. In the field of statistics, probability distribution charts can become quite complicated. The normal distribution, also known as the "bell curve," is perhaps the most widely used probability distribution, although there are several other distributions that are also widely used.